
If you’re experiencing unexpected Windows shutdowns or your favorite game keeps crashing, it’s time to start sleuthing. That’s where Windows Reliability Monitor can help. This native tool provides a user-friendly interface to aid in identifying and fixing system crashes, Windows update issues, hardware, and driver problems.
I’ve been using the Windows Reliability Monitor since it shipped way back in 2008 when it came as part of Windows Server 2008 and Windows Vista. The funny thing is, many Windows users don’t know this hidden little tool exists or how to use it, so I’ll do my best to demystify this helpful tool and get you on the path to a more stable Windows experience.
What is the Windows Reliability Monitor?
At its core, Reliability Monitor works as a diagnostic tool that helps identify system problems and maintain a healthy and reliable Windows experience. It does this via a graphical timeline that displays a comprehensive view of system performance using the System Stability chart and the Reliability Index, which we’ll get into later.
Inside, you’ll find critical errors, warnings, and information events. This data can help find the root cause of system instability, application crashes, driver incompatibility, and hardware failures.
Opening Reliability Monitor on Windows 11
Microsoft has hidden this helpful tool under a few clicks, but getting there is easy if you know how. The easiest way to navigate to the Reliability Monitor is by using the Start menu search box.
Start typing out “reliability,” and “View reliability history” will appear as you type.

Control Panel
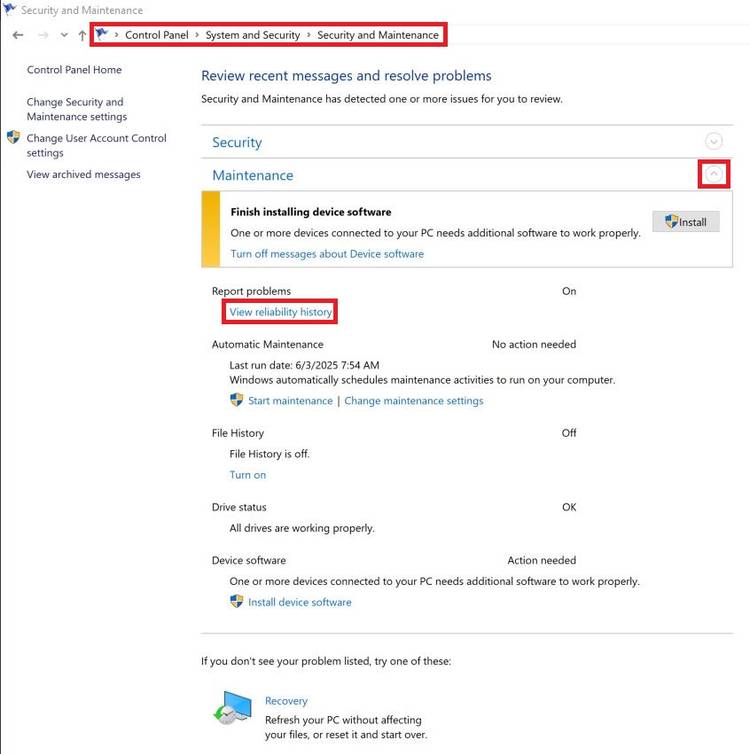
If you’d like to access the monitor from the Windows control panel, click on “System and Security,” then click “Security and Maintenance,” and you’ll see the “View reliability history” in the Maintenance drop-down.
From the Command Prompt
Some people love using the command prompt. If that’s you, access the Reliability Monitor by typing “perfmon /rel” from the command line. Hit enter and you’re in.

Adding a Shortcut to the Desktop
I recommend creating a shortcut right from your desktop to make it even easier to access. To do this, right-click on an empty spot on your desktop and click New > Shortcut.

Then add the path to the tool:

Now let’s name our shortcut appropriately, then click finish.

However you get there, the data inside can provide helpful clues regarding what’s happening on your computer.

Related
How to Use Advanced Startup Options to Fix a Windows 11 PC
The Advanced Startup Options will be your new best friend if your Windows PC is malfunctioning.
Exploring Windows Reliability Monitor User Interface
Let’s dive right into the interface. You can choose days or weeks in the upper left corner of the chart. There is a month’s worth of data available in the chart, and a lot more data if you click “View all problem reports” at the bottom left-hand side of the tool.

Across the top of the chart, the blue line plots the “Reliability Scale,” which ranges from 10, being the most reliable, to 1, being the least reliable.

On the right-hand side of the chart, each of the rows is labeled.
- Application Failures
- Windows Failures
- Miscellaneous Failures
- Warnings
- Information

Event Categories
In the rows, we can see different icons indicating what kind of event was logged. Here is what each icon in the chart means:
- The red circle with the “x” through it means there has been a critical event that has impacted system reliability.
- The yellow triangle with the exclamation point (!) inside represents warning events that have not impacted system stability directly. Still, it’s good to be aware of these items to head off a problem.
- The blue circle with the letter “i” represents information events. These will provide data on different successful updates.
Making Use of the Data in Windows Reliability Monitor
So, let’s take a look at this data in action. Looking at that index, I can see that on May 20th, my system reliability index dropped to 5. If I click on the date, indicated by the blue background, I can see that my system had a lot happening that day. I had two critical events: a warning regarding Copilot, and many updates and app reconfigurations.

You can then click on any of the items here to view the technical details of the event. In the example below, you can see the technical details of a Microsoft Copilot update that failed. In it, I can see the Windows error, 0x80073D02. By performing a few searches, I can learn more about the error and potentially how to fix it.

This type of data can be invaluable when troubleshooting different issues, for example, when an app keeps crashing. The Information Event might indicate that the app in question began crashing right after an antivirus update. By temporarily disabling your antivirus, you could confirm that this is the case. Now you can add the app to the antivirus’s exceptions or roll back the update. You might also ensure that your app version is up to date.
Another scenario might involve seeing several hardware related errors. With that knowledge, you might investigate within the device manager for any hardware failures or drivers that need updating. I recently had an HDMI port go bad on my multi-monitor desktop. The Reliability Monitor data led me to the device manager, where I spotted the failed hardware. After reinstalling the driver and changing cables didn’t work, I used a USB hub and got my second monitor working again.
If you’re having regular crashes on your PC, you could look at the data to identify how often it’s happening and when the instability began. The data could point to a Windows update or a new driver installation.
Any way you slice it, Windows Reliability Monitor is worth digging into. Its user-friendly design allows the average Windows user to get to the root of pesky crashes and freezing to get back to work.
That said, Reliability Monitor alone won’t solve all your problems. Sometimes you may not find what you’re looking for; in that case, you may try the Windows Event Viewer. There are also plenty of other ways to monitor and improve the health of your Windows machine.